Credit spread option strategies are hugely popular with income traders as they can generate profits in multiple conditions.
In this article I’ll briefly discuss the 3 strategies, show you how they’re set up and then I’ll show you some real examples, so you can see how each of the strategies performs relative to changes in the stock price over time.
Credit spreads, or vertical spreads as they are sometimes called are high probability trades and can profit in more than one way.
They can even profit if the stock moves against you, as long as it doesn’t move too far, as you will see shortly.
Credit spreads can profit in the following ways:
- Favorable movement in the stock price
- Small, unfavourable movement in the stock price
- Time decay
- Decrease in implied volatility
The best time to enter credit spreads is when implied volatility is high. When this occurs, trades can be placed further away from the stock price giving the trade more margin for error.
WHAT IS A CREDIT SPREAD
A credit spread is an option strategy that involves selling an option and then buying a further out-of-the-money option in the same expiry period.
Credit spreads are an income strategy, because premium is collected when initiating the trade. This is because the option that is being sold has a higher premium than the option that is being bought.
Let’s look at an example:
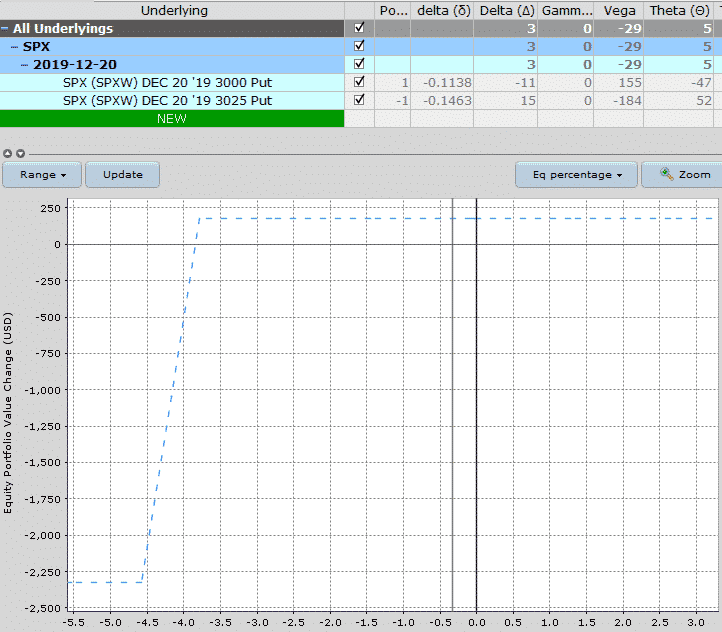
Assuming we are bullish on the S&P 500 over the next month, we could sell a put credit spread on SPX.
Typically, this would be below the market. Some people like to use the 10 delta or the 15 delta as the short strike.
Using the 15 delta, the setup would look something like this:
Date: November 26th, 2019
Current Price: $3,132
Trade Set Up:
Sell 1 SPX December 20th, 3025 put @ $8.30
Buy 1 SPX December 20th, 3000 put @ $6.50
Premium: $180 Net Credit
Capital at Risk: $2,320
Return Potential: 7.76%
KEY FEATURES OF OPTION CREDIT SPREADS
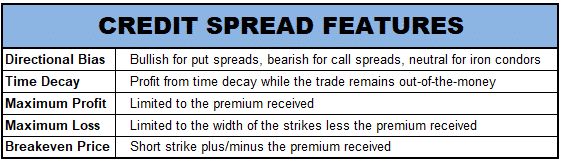
PUT CREDIT SPREADS
Put credit spreads are a fantastic strategy because stocks tend to rise over time.
This is a strategy that you would implement if you were bullish on a stock or felt that it wouldn’t decline by too much during the trade.
A put credit spread is known as a bull put spread and is constructed by:
- Selling a put option
- Buying another put option at a lower strike price in the same expiry period
Most people trade bull put spreads as out-of-the-money spreads which gives them a good margin for error on the trade.
The further out-of-the-money the trade is placed, the less premium that is received and the higher the capital at risk in the trade.
Let’s look at an example:
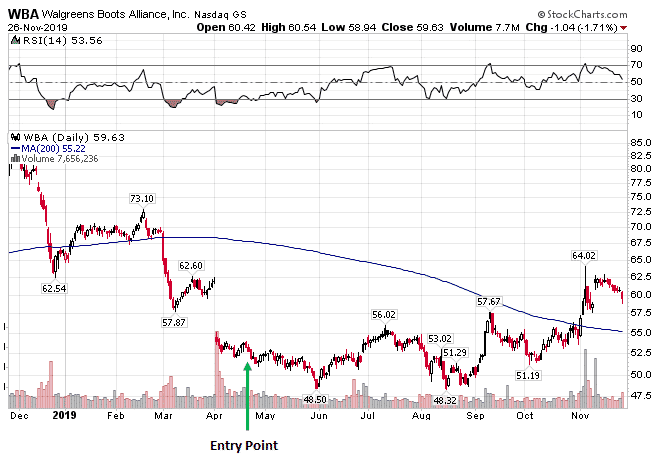
One regular trade I like to do is a long-term bull put credit spread on Dow stocks that have become oversold.
Here’s a trade from early in 2019 on WBA:
Date: April 22nd, 2019
Current Price: $54.35
Trade Set Up:
Sell 10 WBA January 17th 2020, 40 puts @ $0.90
Buy 10 WBA January 17th 2020, 35 puts @ $0.40
Premium: $500 Net Credit
Capital at Risk: $4,500
Return Potential: 11.11%
Since entering the trade WBA has reached a low of $48.32 in August and in late November was trading at $59.63 with the put credit spread currently sitting at +$440 in P&L.
I’ll look to close the trade out now as there isn’t much premium left and closing the trade can free up the capital for other trades.
Because this was such a long-term trade, it allowed me to place the spread a huge distance away from the WBA price.
At the time, the $40 strike which I sold was 25% below the stock price!
CALL CREDIT SPREADS
Call credit spreads are implemented by traders who think a stock will decline or not rise by much during the trade.
A call credit spread is known as a bear call spread as is constructed by:
- Selling a call option
- Buying another call option at a higher strike price in the same expiry period
The further out-of-the-money the trade is placed, the less premium is received and the higher the capital at risk in the trade.
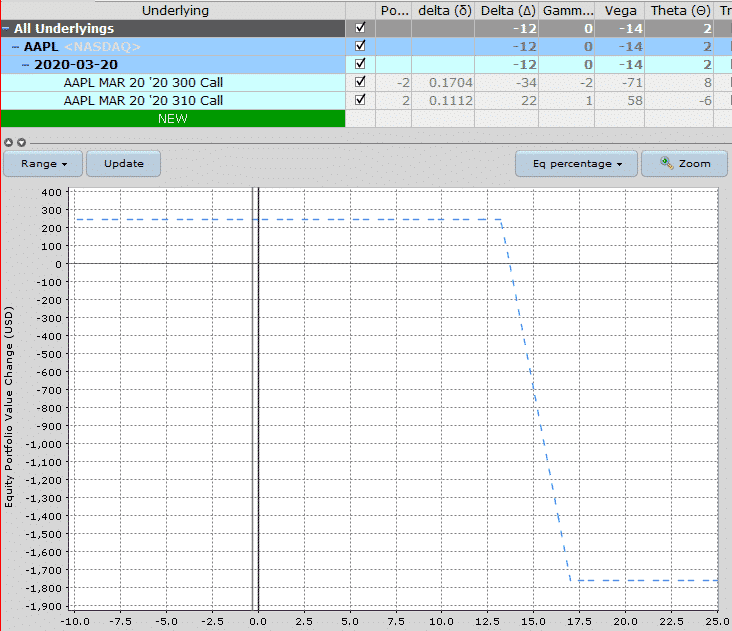
Let’s look at an example:
AAPL is currently one of the most overbought stocks in the Dow and looking a little toppy.
While the stock may continue to grind higher, a pullback is definitely overdue and fairly likely at some point in the in the next few weeks.
Date: November 26th, 2019
Current Price: $264
Trade Set Up:
Sell 2 AAPL March 20th 2020, 300 calls @ $3.07
Buy 2 AAPL March 20th 2020, 310 calls @ $1.85
Premium: $244 Net Credit
Capital at Risk: $1,756
Return Potential: 13.90%
The only downside with this trade is that implied volatility is currently so low in AAPL, that I can’t place the spread as far out-of-the-money as I normally could.
Still, with the short strike at $300, AAPL can rally 13.65% before the short strike is touched.
IRON CONDOR CREDIT SPREAD
When you combine a put credit spread and a call credit spread, you get a position known as an iron condor.
This is a direction neutral trade and will profit if the stock remains between the two spreads during the course of the trade.
If you want some detailed training on iron condors, you can check out my free course here.
Let’s look at a quick example:
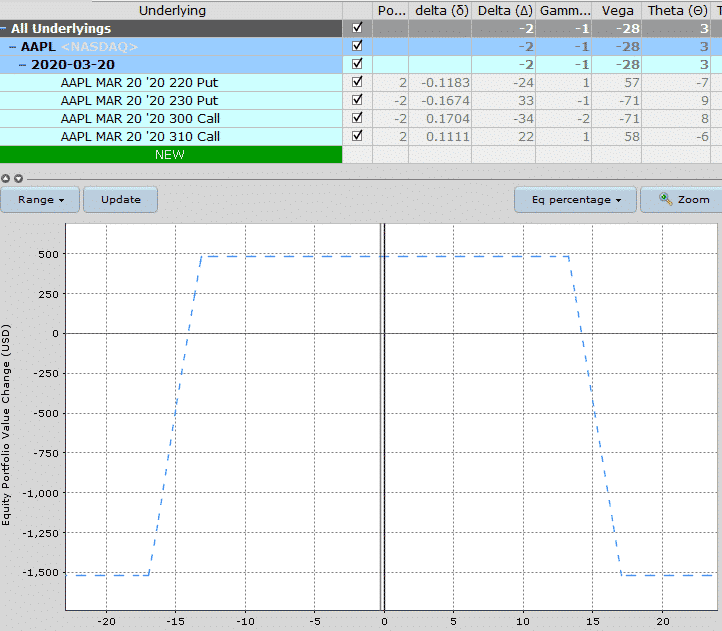
Using our AAPL example, we can add a put credit spread to turn it into an iron condor.
Date: November 26th, 2019
Current Price: $264
Trade Set Up:
Sell 2 AAPL March 20th 2020, 300 calls @ $3.07
Buy 2 AAPL March 20th 2020, 310 calls @ $1.85
Add put credit spread
Sell 2 AAPL March 20th 2020, 230 puts @ $3.84
Buy 2 AAPL March 20th 2020, 220 puts @ $2.65
Premium: $482 Net Credit
Capital at Risk: $1,518
Return Potential: 31.75%
Notice that by generating two lots of premium, we have more than doubled our return potential. You may have also noticed that the capital at risk has decreased.
This is due to the extra premium received while the spreads are the same distance apart.
As above, the only issue with this trade idea is that implied volatility is very low, so it may not be the best time for an iron condor.
WEEKLY CREDIT SPREADS FOR INCOME
Weekly credit spreads can be excellent for generating income, but they are not without risks.
Before we look at the risks, let’s talk about the positives.
The main reason for trading weekly credit spreads is that they provide HUGE amounts of time decay, so profits can be generated very quickly.
Access the Top 5 Tools for Option Traders
Here’s an example of how it works.
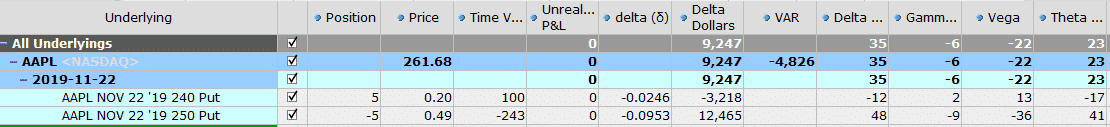
This weekly credit spread on AAPL, selling the roughly 10 delta puts, has a theta value of 23. This means that the position will make roughly $23 per day through time decay, all else being equal.
This trade is also selling the 10 delta puts but is a 65-day trade.
The time decay here is only 4$ per day.
As you can see, there is a big difference in the amount of time decay generated from weekly credit spreads compared to monthly or two-month credit spreads.
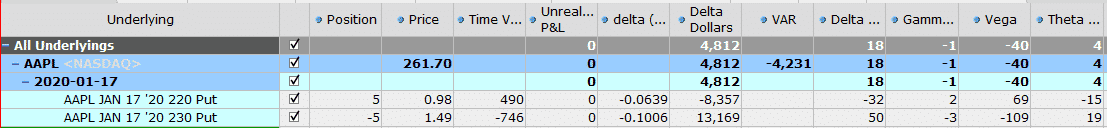
Notice the difference in Gamma as well.
I won’t go into detail now, you can read more about Gamma here and here. Just know that the difference between -1 Gamma and -6 Gamma is significant.
Beginner traders get very excited by the profit potential and fail to realize or fully understand the risk.
There are many websites and “gurus” out there claiming it’s “super easy” to make 5% per week.
Now, anyone with a basic understanding of finance understands that higher returns equal higher risk.
Therefore, if someone is claiming to make 5% per week (which equates to 260% per year), do you think there is much risk involved??
I know my readers are much too smart to fall for those sort of marketing gimmicks, but you would be surprised how many people get sucked in to this way of trading.
I can’t tell you how many times I’ve spoken to traders and they all have the same story:
WEEKLY CREDIT SPREAD HORROR STORIES
The stock and timing is different, but the scenario is always the same.
“Things were going great, I had 20 winning weeks in a row, and then the market made a big move and BAM, all 20 weeks’ worth of gains were gone, and then some.”
It can happen quickly as well. That gamma risk I talked about earlier, that basically means that even for a small move in the underlying stock, the P&L on the position will move wildly.
That can be great if the stock goes your way, but it can be disastrous if it moves against you.
A high gamma also means that your delta exposure will pick up steam quickly as the position moves against you.
So not only are your losses accelerating, your delta exposure is also getting bigger and bigger.
In a situation like this, there is very little you can do to adjust or save the trade. You can hope the stock reverses, but hope is not a valid strategy.

MONTHLY CREDIT SPREADS FOR INCOME
Monthly credit spreads are also a great option strategy for generating income and they move a lot slower than weekly credit spreads.
This allows you more time to adjust and can give you flexibility by allowing you to stay in the trade longer, even if the stock is moving against you.
One thing I have moved to recently is going even longer term with my credit spreads (see WBA example above).
These trades move very, very slowly, but can still generate excellent returns on an annualized basis with much less stress.
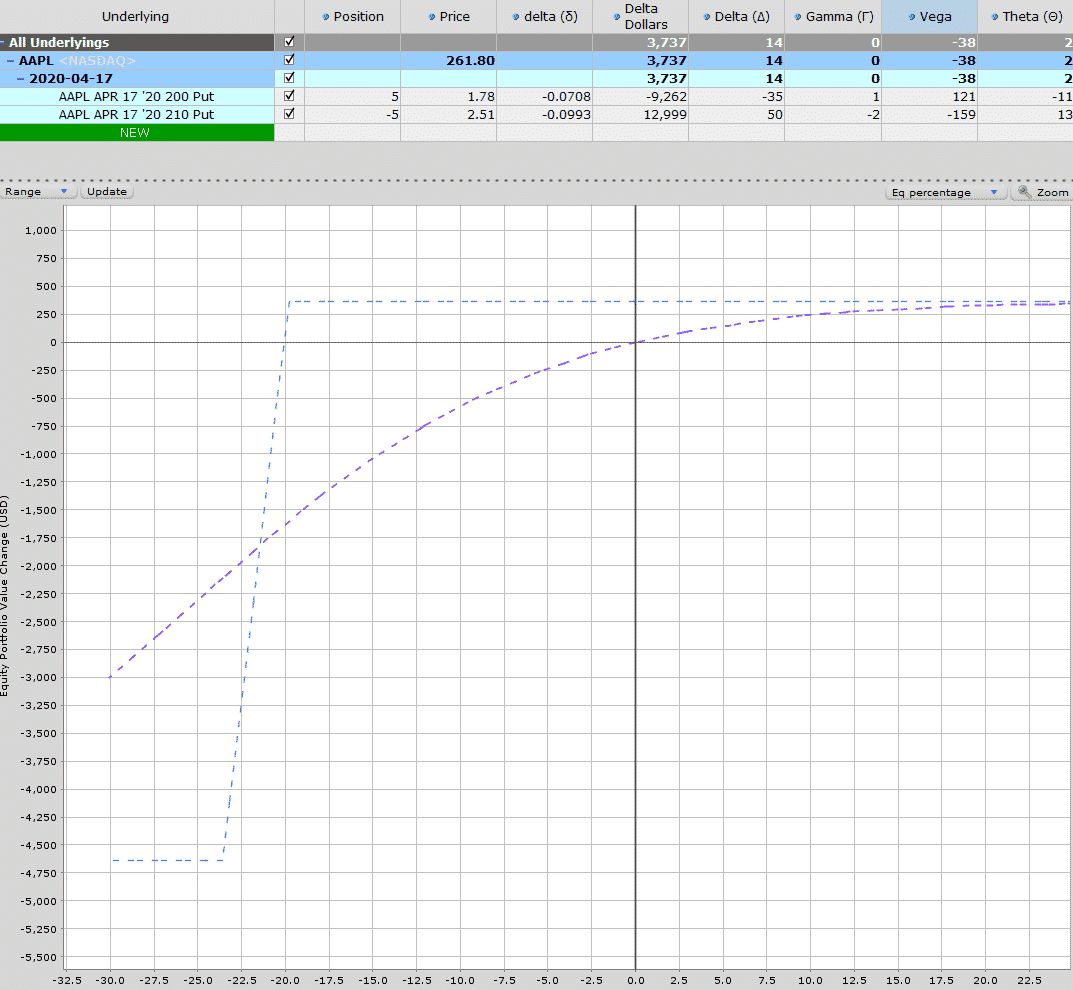
Let’s use AAPL again and compare a 1-month put credit spread and a 6-month put credit spread using the 10-delta strike as the short strike.
1-MONTH BULL PUT SPREAD
This one-month bull put spread has the potential to make $250 in profit while risking $4,750 for a return of 5.26% in one month or 63.15% annualized.
Time decay is $7 per day and gamma is -2. The purple line below is the T+0 line which gives a good estimate of what could happen if the stock drops.
If AAPL drops 2.5% the trade will be down around $250 and if the stock drops 10% the trade will be down around $1,700.
Note that this does not take into account any changes in implied volatility, so the losses would likely be a bit higher than that.
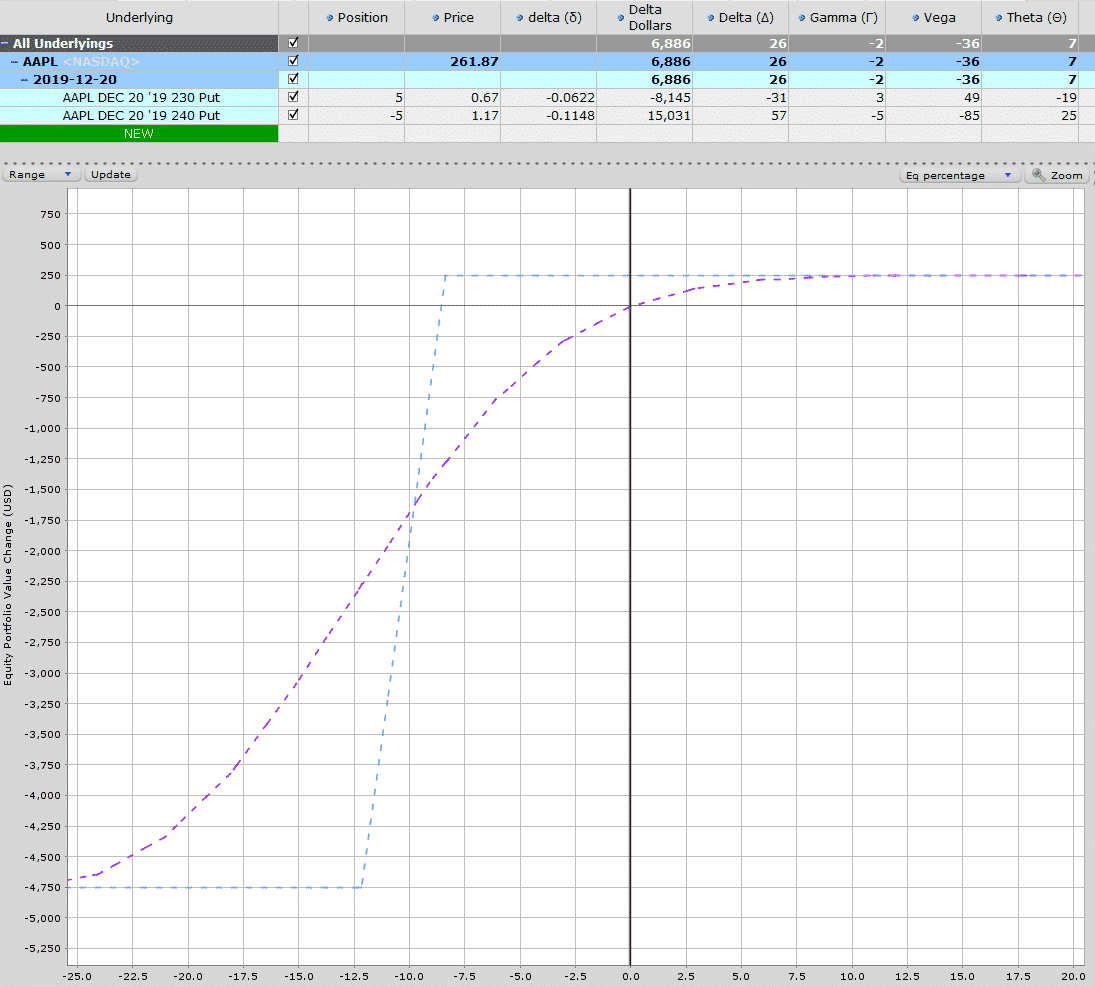
6-MONTH BULL PUT SPREAD
This 6-month trade is also short the 10-delta put and generates slightly more income at $365 with capital at risk of $4,635.
That represents a 7.87% return in 6-months or around 15.75% per annum. That’s still a pretty nice return in my books for a trade that will move a lot slower.
Time decay is $2 per day and gamma is basically zero.
Notice the slop of the T+0 line is much less severe than the 1-month trade.
If AAPL drops 2.5%, this trade would be down around $100 and if it dropped 10% the trade would be down about $550-600, much better than $1,700!
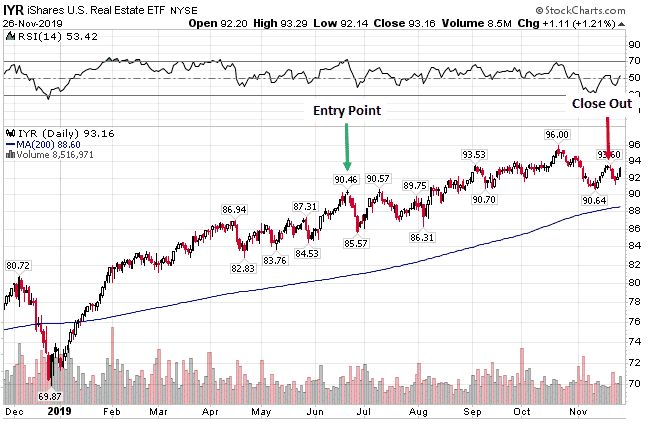
IYR BEAR CALL SPREAD EXAMPLE – GETTING DIRECTION WRONG BUT STILL A WINNING TRADE
Back in June 2019, I started to get bearish on REIT’s after they had rallied 28% in 6 months. I even wrote about it here.
On Just 20th, I entered a bear call spread on IYR.
At the time, the stock was trading at $90.87 and I sold some December 2019 $95-$100 call spreads.
Date: June 20th, 2019
Current Price: $90.87
Trade Set Up:
Sell 2 IYR December 20th, 95 calls @ $1.14
Buy 2 IYR December 20th, 100 calls @ $0.29
Premium: $170 Net Credit
Capital at Risk: $830
Return Potential: 20.48%
Initially, the trade started to work for me as IYR fell to just below $86, but then the ETF rallied back and continued to grind higher over the next few months.
On October 21st, IYR closed at $95.36 and the bear call spread was down $220. I don’t like letting credit spreads go in-the-money, but I will let that happen sometimes with these long-term trades.
In this case I still felt like there would be a pullback at some point before December expiry and that proved to be the case with IYR dropping down to $91 by November 8th.
I closed the call spread for $0.16 on November 15th with IYR trading around $92.50. The initial spread was sold for $0.85 and closed for $0.16 for a total profit of $0.69 or 16.63% on capital at risk in about 5 months.
Not bad for a bearish trade where the underlying asset rallied 1.79% between trade initiation and close out.
CONCLUSION
Trading credit spreads for income is an incredibly popular strategy with income traders. Here are some of the key takeaways from today’s article:
- Credit spread option strategies generate premium because the sold option has a higher value than the bought option.
- Credit spreads can still be profitable if the underlying stock moves against you, as long as it doesn’t move too much.
- Trades can be placed on a directional (bull put or bear call) or neutral basis (iron condor).
- Weekly credit spreads can generate significant income in a short space of time, but they can be risky.
- Long-term credit spreads generate profits more slowly but also lose money at a slower rate if the trade goes against you.
- The best time to enter credit spreads is when implied volatility is high. When this occurs, trades can be placed further away from the stock price giving the trade more margin for error.
I hope you enjoyed this article, please feel free to comment below or share on social media.
Trade safe!
Gav.
Disclaimer: The information above is for educational purposes only and should not be treated as investment advice. The strategy presented would not be suitable for investors who are not familiar with exchange traded options. Any readers interested in this strategy should do their own research and seek advice from a licensed financial adviser.


